To accurately measure the static
thrust produced by a water rocket.
To compare water only and foam
thrust curves and their corresponding
performance.
To test what choking effect a
Robinson coupling has on performance.
To measure what effect foaming agent
concentration has on performance.
Test Stand Experiments
Below is a mini
index to make it easier to jump over the
boring sections.
For further reading of other people's
experiments and theory see the
reference section.
Water rocket (and pyro)
thrust experiments have been
performed by many dedicated individuals and
teams over
the years and we have drawn on their
knowledge, analysis and their results in
helping us
perform
these
experiments.
Disclaimer: While all
the experiments were produced with care we
acknowledge that there may be errors
and that the interpretation might also need
further work. We explain our measurement
process below, and provide all the raw and
processed data for those interested in
performing
further analysis and draw their own
conclusions.
IMPORTANT NOTE: These
thrust curvesare for static tests and
somewhat differ to actual
flight thrust curves.
However, for relative
comparisons they are still valid.
Before we delve into the
actual results it's important to understand
how accurate the results are and how we
calibrate the test stand. The full details
of our test stand can be found
here.
Calibration
Since the load cell amplifier's gain
can be adjusted, the amplitude of the
measured thrust curve is only a relative
value. In order to get absolute readings
and be able to compare them against those
taken at a different gain settings we need
to calibrate the readings each time we
change the gain. The gain,
however, can also drift
slightly with temperature so in order to get
the most accurate results
we
calibrate each test.
After each firing and while the data
logger is still recording we suspend a 1Kg
load from the nozzle of
the empty rocket for a period of time.
This records a 9.8N step
difference in the waveform. As this is constant all the other values
on the waveform can be
scaled relative to this difference.
See the software
section for more details.
Waveform showing the recorded 1Kg weight
at the end of the test.
Although we
know the weight of the water, we
can't really use
the difference between the empty and full
rocket because while the rocket is full, the
release mechanism and air supply hose also
hang off the nozzle. (ie. they weigh
something) Since the hose is resting on
the ground it can give different readings
each time.
We tested the
linearity of the load cell by applying known
weights and plotting them against the
reading as recorded by the data logger. The
linearity was within 1% over the range we
tested.
Accuracy and
Repeatability of Measurements
In order to minimize
errors in measurement due to variances in
pressure and water amounts, we run multiple
tests with identical setups and then compare
and average the results.
We use a pressure
regulator with a fine adjustment that allows
us to repeat the pressures quite accurately.
This is, however, likely to be have the
highest error.
We measure the water
amount going into the rocket on a digital
scale rather than sighting along the
meniscus and this gives us an accuracy of
around 1mL. Some amount of water in
the form of water droplets will always
remain in the container, in the funnel and
in the rocket after each test. Over multiple
tests, the amount of water in the droplets
remains more or less constant.
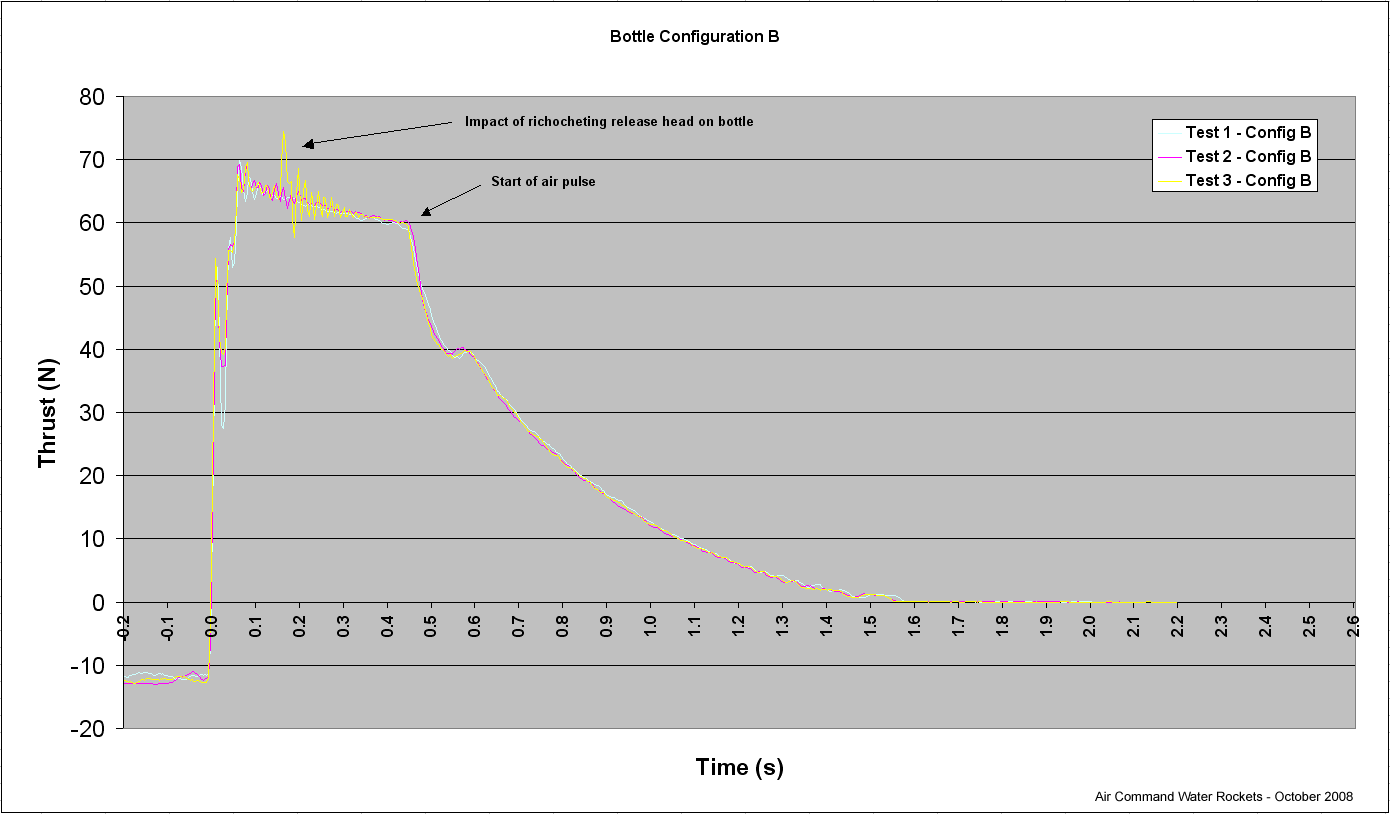
An example of three
test runs is shown below. The curves show
almost identical timing and shape. The total
impulse for these curves is within 0.01 %
of
the average. NOTE: The "ringing" seen in
waveform 3 was caused by the ricocheting
release head hitting the side of the bottle.
This did not alter the thrust.
Close correlation between three separate
runs
Turning raw data into
thrust measurement
The thrust we measure here we are calling
"Static effective thrust". 'Static' because
the rocket is not moving and hence any
change in thrust due to acceleration is not
taken into account. 'Effective' because the
thrust we measure only takes into account
the thrust that causes upward acceleration
of a rocket having zero mass. The curve also
incorporates the weight of water as a
negative thrust component due to the need to
orient the rocket vertically. If we
determine the rate of water loss we can add
that component back to the thrust curve.
The weight change can be simulated and
added to the actual data, however, in most
instances this is not necessary if we are
doing relative comparisons between designs.
In the calculations below we calculate
the total impulse as the area under the
curve and above the horizontal "zero
thrust" line. To include the
weight of the rocket one needs to draw a
horizontal line above the zero thrust line
representing the weight. The area above this
new line and below the curve represents the
total amount of thrust contributing to the
vertical acceleration of the rocket. If the
entire thrust curve falls below this line
then the rocket will never leave the ground.
Other
Notes
We use coloured water
in the experiments for two reasons:
a) For more
contrast when reviewing video, and;
b)Each
water quantity has a different colour code
to make the test data easier to verify in
video and pictures.
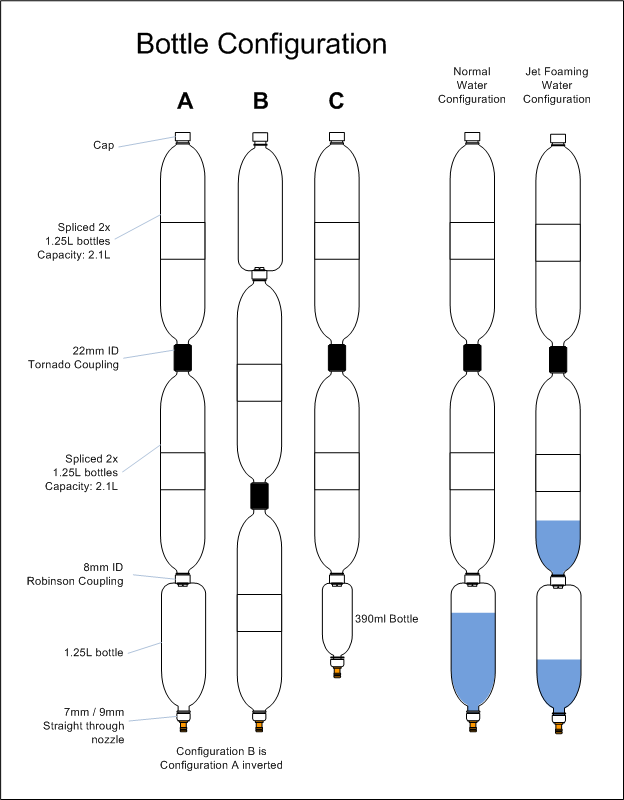
The following diagram describes the
different bottle and water configurations
used by the experiments.
Bottle Configuration
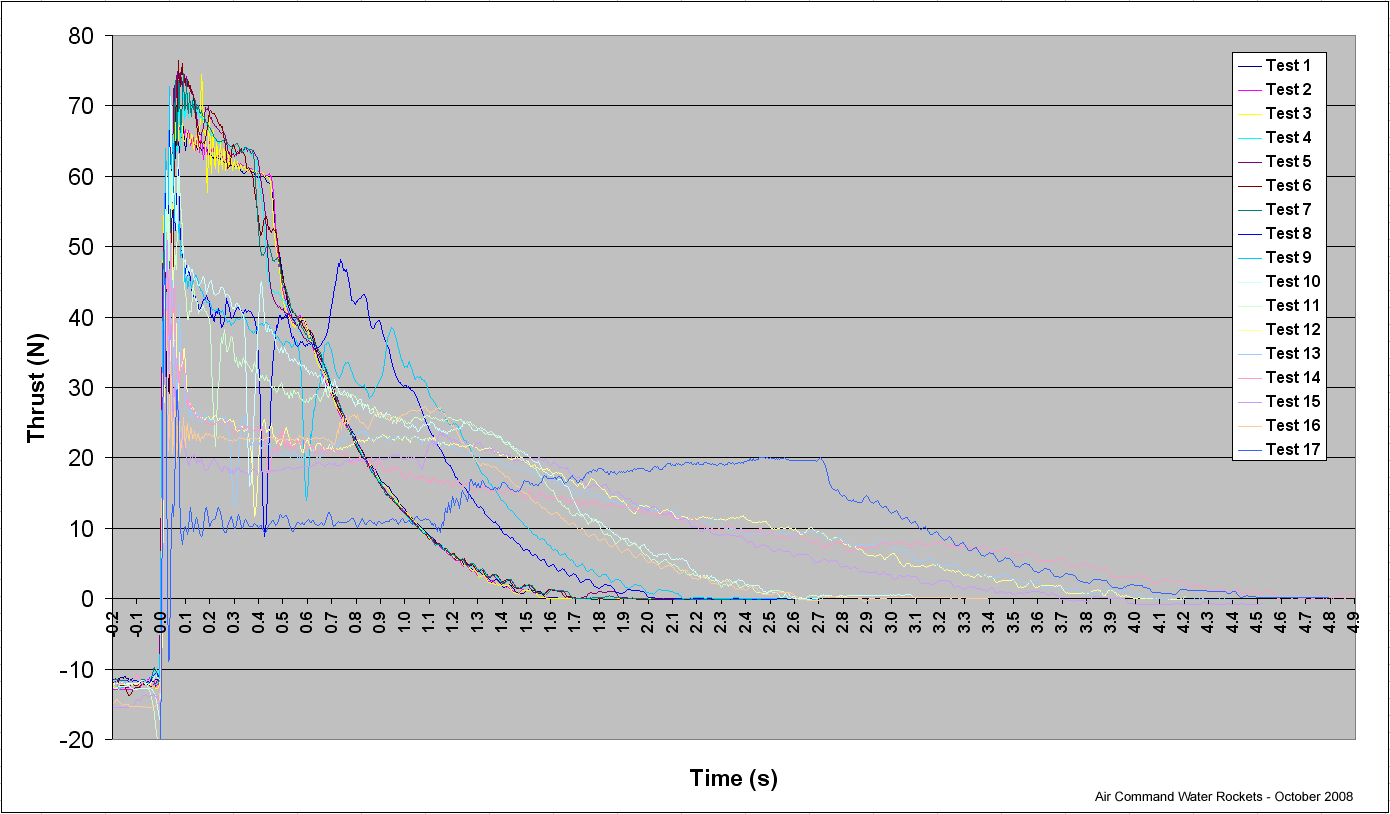
Test Result Summary
The table below
gives a summary of all the static
tests performed on the day. The experiments
will refer to this table.
The raw and processed data
is availablehere. This archive includes the full
recording and the 1Kg calibration
measurements with each test.
Test #
Capacity
(mL)
Water
(mL)
Foam
(mL)
Nozzle
(mm)
Pressure
(psi / bar)
Av. Thrust
(N)
Total Impulse
(Ns)
Notes
1
5450
1000
0
9
110 / 7.6
28.74
45.86
Bottle configuration B, normal water
config.
2
5450
1000
0
9
110 / 7.6
28.66
45.86
Bottle configuration B, normal water
config.
3
5450
1000
0
9
110 / 7.6
28.68
45.89
Bottle configuration B, normal water
config.
4
5450
1000
0
9
110 / 7.6
27.47
46.48
Bottle configuration A, normal water
config.
5
5450
1000
0
9
110 / 7.6
27.62
46.84
Bottle configuration A, normal water
config.
6
5450
1000
0
9
110 / 7.6
27.93
46.55
Bottle configuration A, normal water
config.
7
5450
1000
0
9
110 / 7.6
27.45
46.67
Bottle configuration A, normal water
config.
8
5450
1000
0
9
110 / 7.6
24.33
49.57
Bottle configuration A, jet foaming
water config
9
5450
1000
0
9
110 / 7.6
24.15
50.82
Bottle configuration A, jet foaming
water config
10
5450
990
10
9
110 / 7.6
21.54
56.01
Bottle configuration A, jet foaming
water config
11
5450
990
10
9
110 / 7.6
20.04
52.03
Bottle configuration A, jet foaming
water config
12
5450
990
10
7
110 / 7.6
13.84
55.36
Bottle configuration A, jet foaming
water config
13
5450
990
10
7
110 / 7.6
13.17
54.45
Bottle configuration A, jet foaming
water config
14
5450
700
300
7
110 / 7.6
11.68
54.53
Bottle configuration A, jet foaming
water config
15
4600
1190
10
7
110 / 7.6
13.05
47.57
Bottle configuration C, jet foaming
water config. Bottom bottle ~40%
full
16
4600
1190
10
7
110 / 7.6
15.83
41.17
Bottle configuration C, jet foaming
water config. Bottom bottle ~95%
full
17
5450
2250
0
7
110 / 7.6
12.27
50.97
Bottle configuration A, jet foaming
water config, fizzy lemonade used as
liquid
Table 1 - Test Result
Summary
Here is a video
with examples of the experiments:
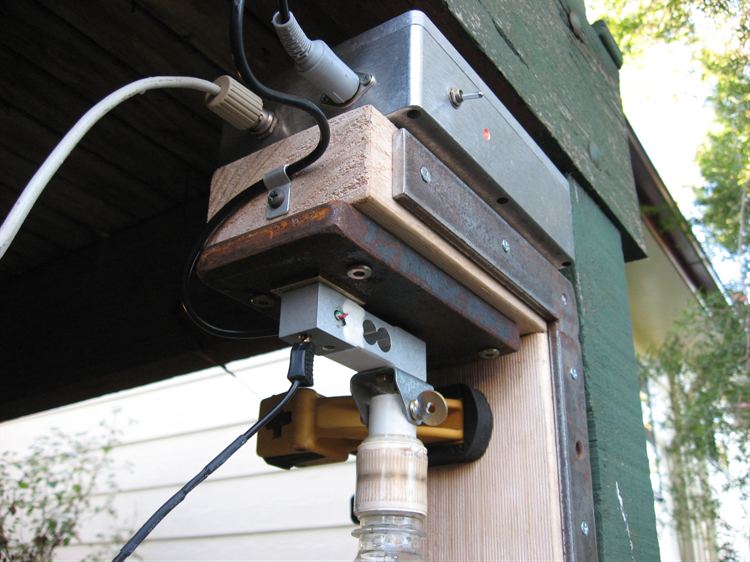
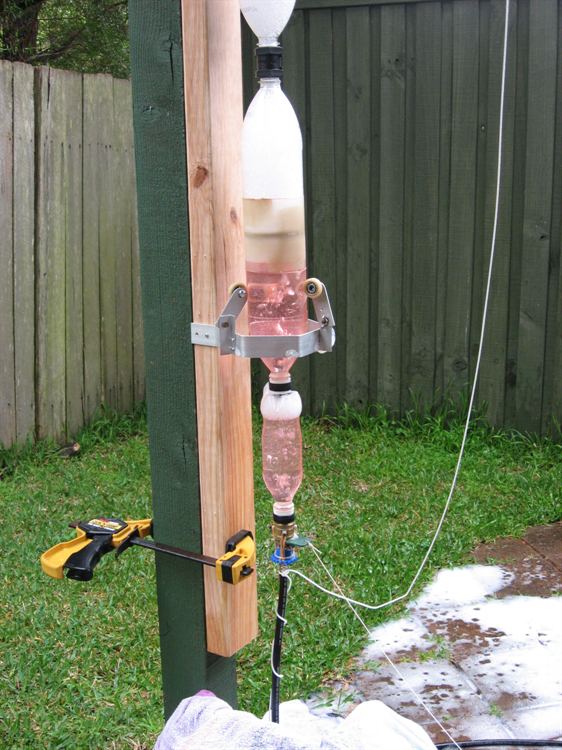
Images
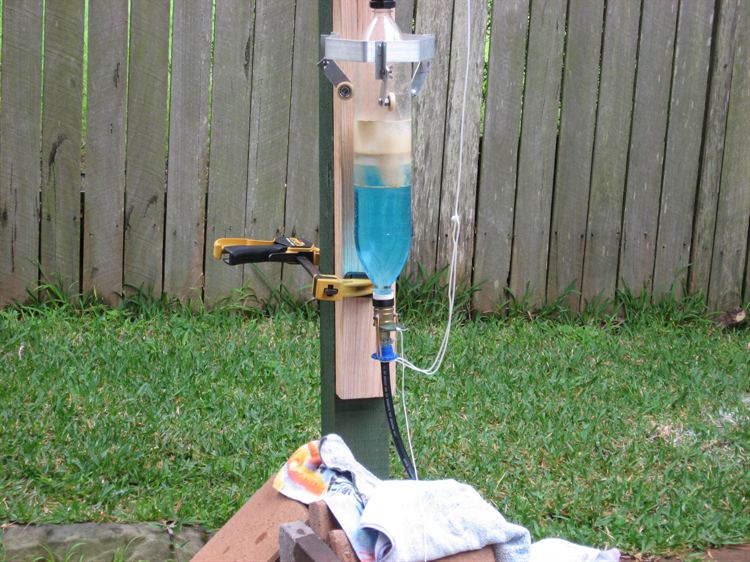
Top of the test stand
with load cell amplifier on top and load cell
connected to the top of the rocket.
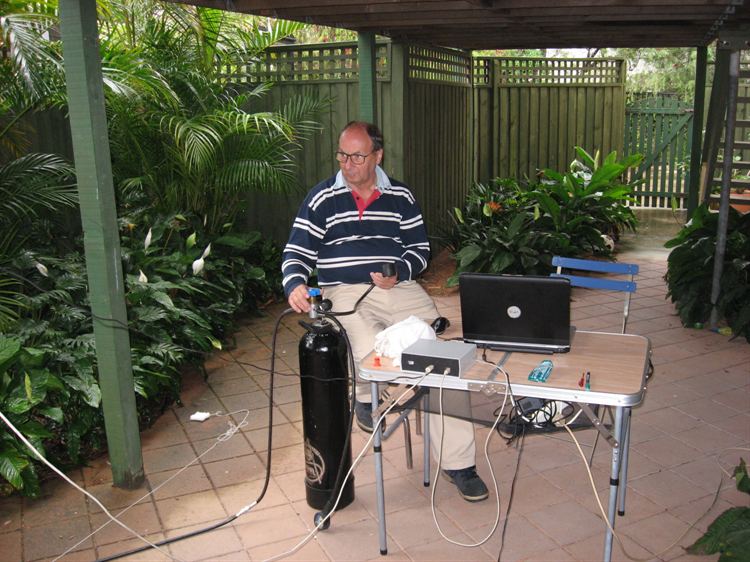
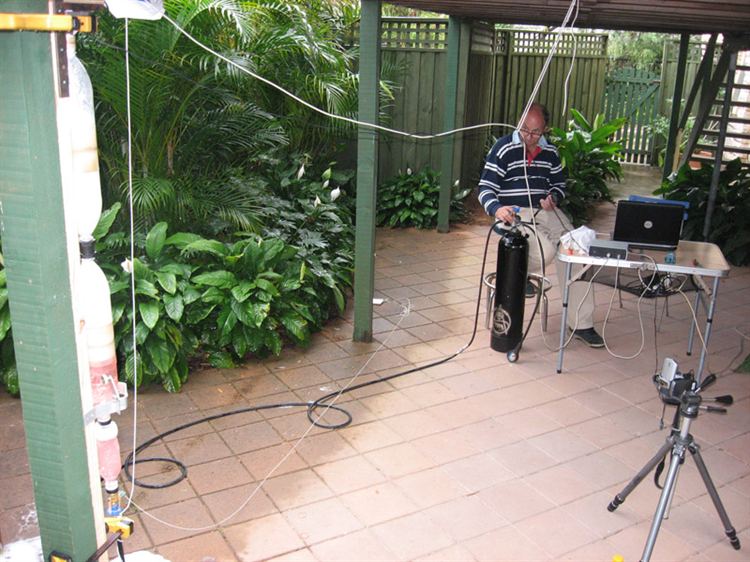
The laptop and data
logger set up nearby. Pressure for the tests was
provided by a scuba tank.
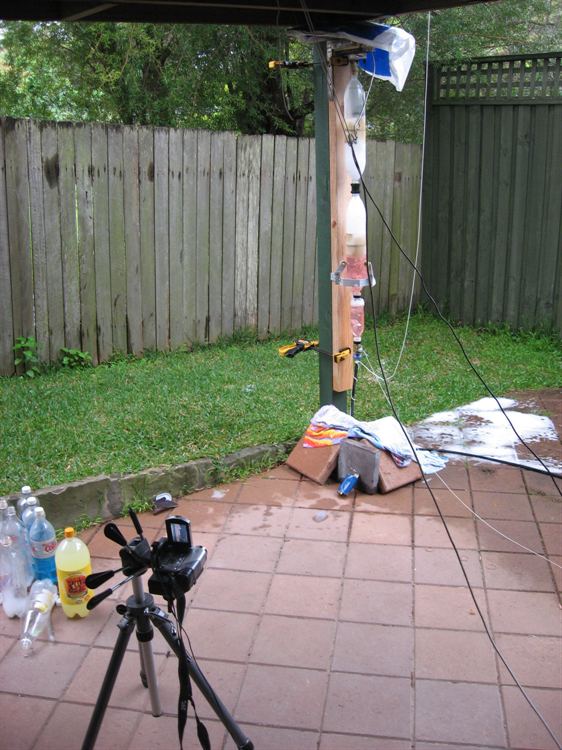
A video camera recorded
each test. A plastic bag protects the
electronics from the rain.
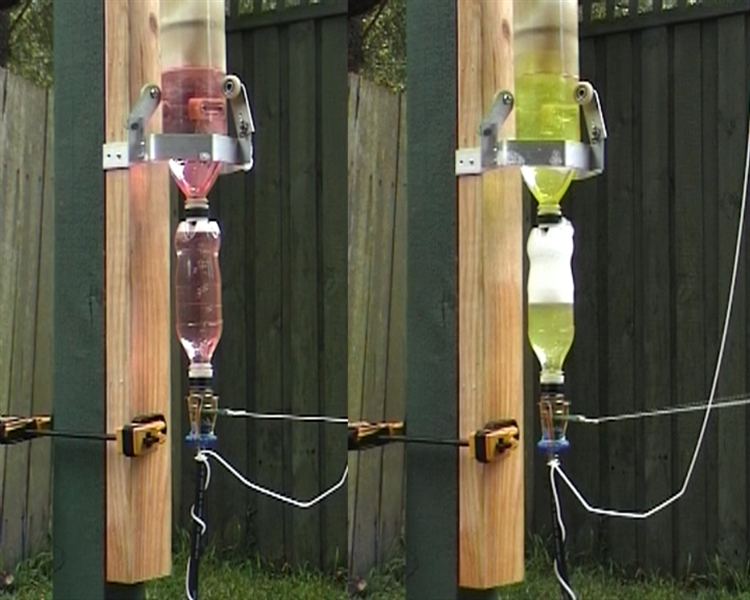
Colour coded water allows
us to easily identify the water amount in images
and videos.
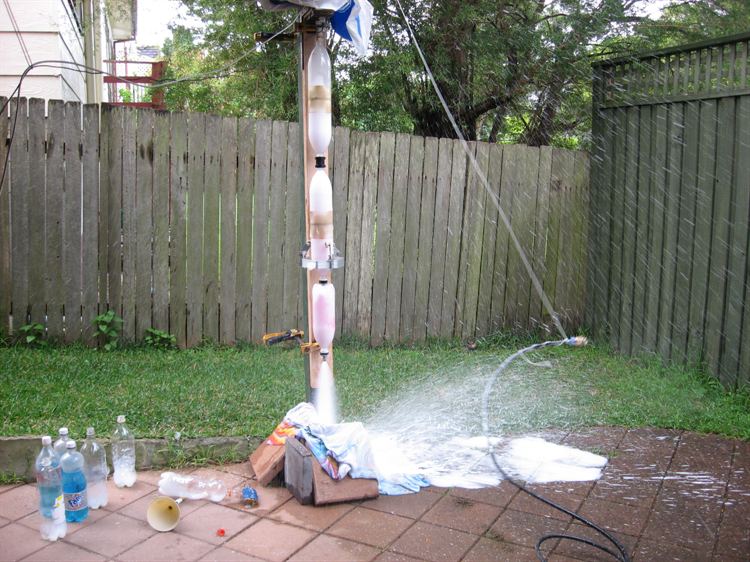
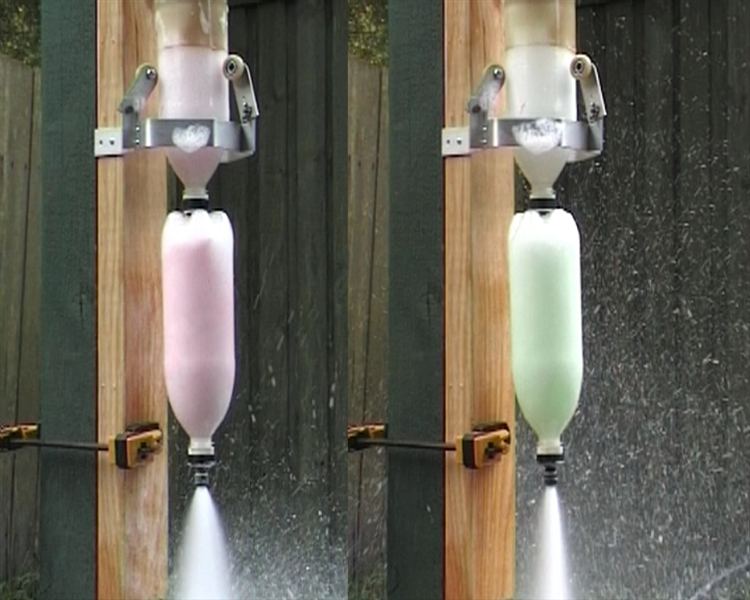
A foam test under way.
The bricks and towel at the bottom deflect the
foam away from us.
Wires, hoses and strings
everywhere.
Testing a reduced foam
mixing chamber to try to reduce the amount of
residue foam left in a rocket.
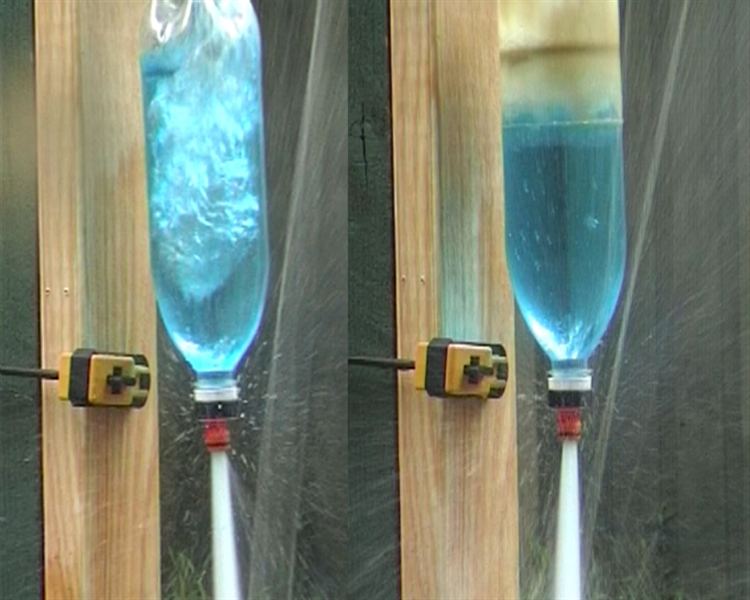
Comparing bottle
configuration A on the left and configuration B
on the right. Blow-through is quite evident in config A.
Testing varying
concentrations of foam. 30% foam on the left,
1% on the right.
Testing reduced mixing
chamber with small and large air pocket in the
chamber.
Experiment #1 - Robinson Couplings
Aim
For this experiment we wanted to see what
effect a Robinson coupling has on the
performance of a rocket. We were looking at
two aspects here.
The
blow through effect
allowing some pressure to escape before all
the water is ejected; and
The internal
chocking effect of the coupling.
Setup
In order to make an accurate comparison
we constructed a rocket with two 2.1L
spliced bottles connected together with a
22mm ID tornado coupling. Then we connected a 1.25L
bottle with an 8mm Robinson coupling at one
end. When used with the Robinson coupling at
the bottom (Configuration
A), pretty much all the air had to
pass through it. When the rocket was turned
upside down (Configuration
B) then most of the air remained in
the tornado coupled sections and therefore
the chocking effect was drastically reduced.
This was to ensure that the volume of the
rocket was identical for both experiments.
Observations
The three tests with
Configuration A showed very close
correlation in timing an amplitude. The
total impulse for the three runs was on
average 45.87 Ns with the three tests within
0.01 %
of the average. The average thrust of the
three runs was 28.69 N with all
within 0.02% of the average.
NOTE: The "ringing" seen in test 3
was due to the release head impacting the
rocket momentarily shortly after release,
however, the thrust measurement was not affected.
The timing of the event was confirmed on video analysis.
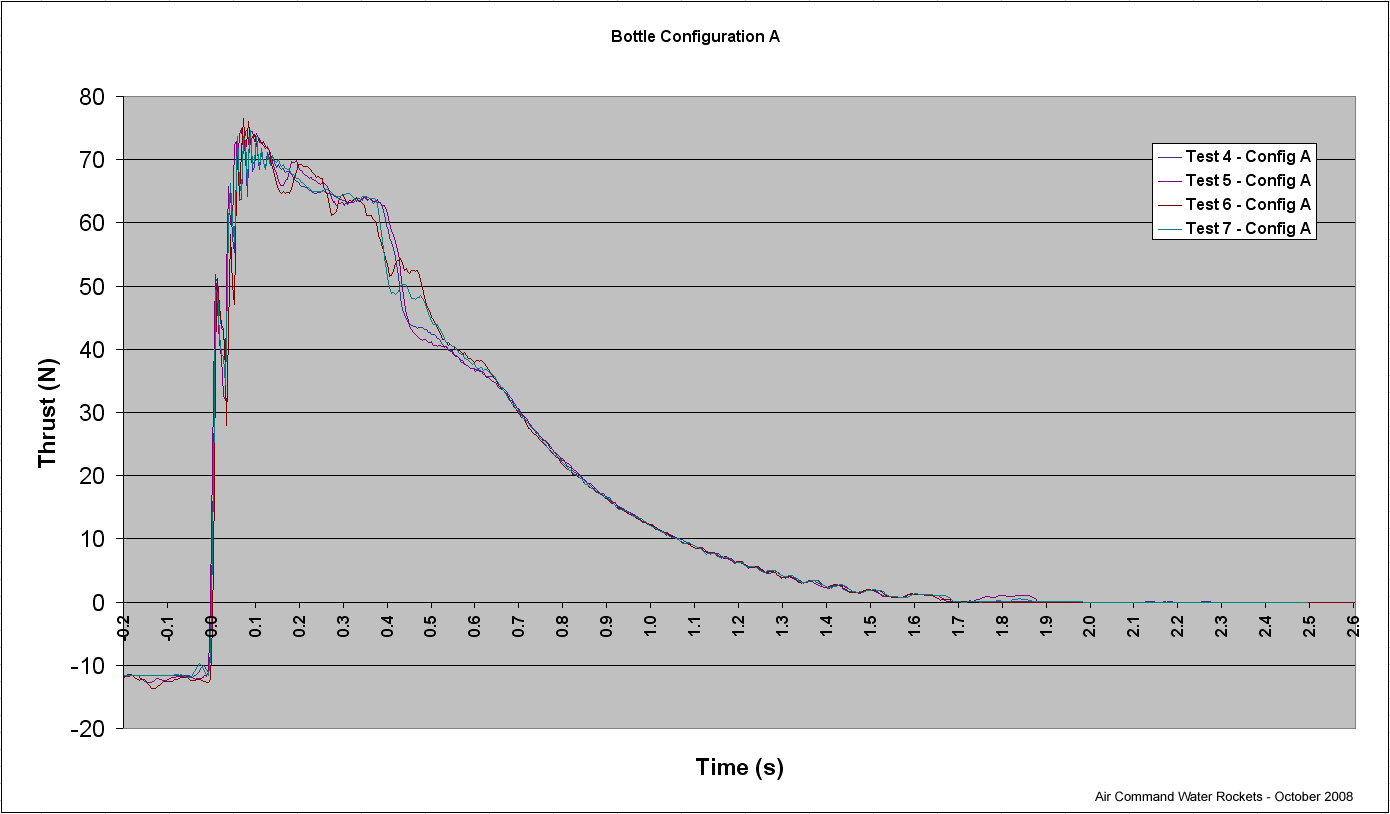
Thrust Curve for Test
1,2 and 3
Configuration B
showed
slightly more variation in the water phase thrust
curve, but this can be attributed to the
turbulence generated in the water due to the
blow through effect. The total impulse
on average was 46.64 Ns all within
0.05% of the average. The average thrust
for the 4 runs was 27.61 N all within
0.1% of the average.
Thrust Curve for Test
4,5,6 and 7
Test #5 and Test #6
show slight dips in the water phase part of
the curve. On video analysis these were traced to
bubbles exiting the nozzle during the blow
through effect.
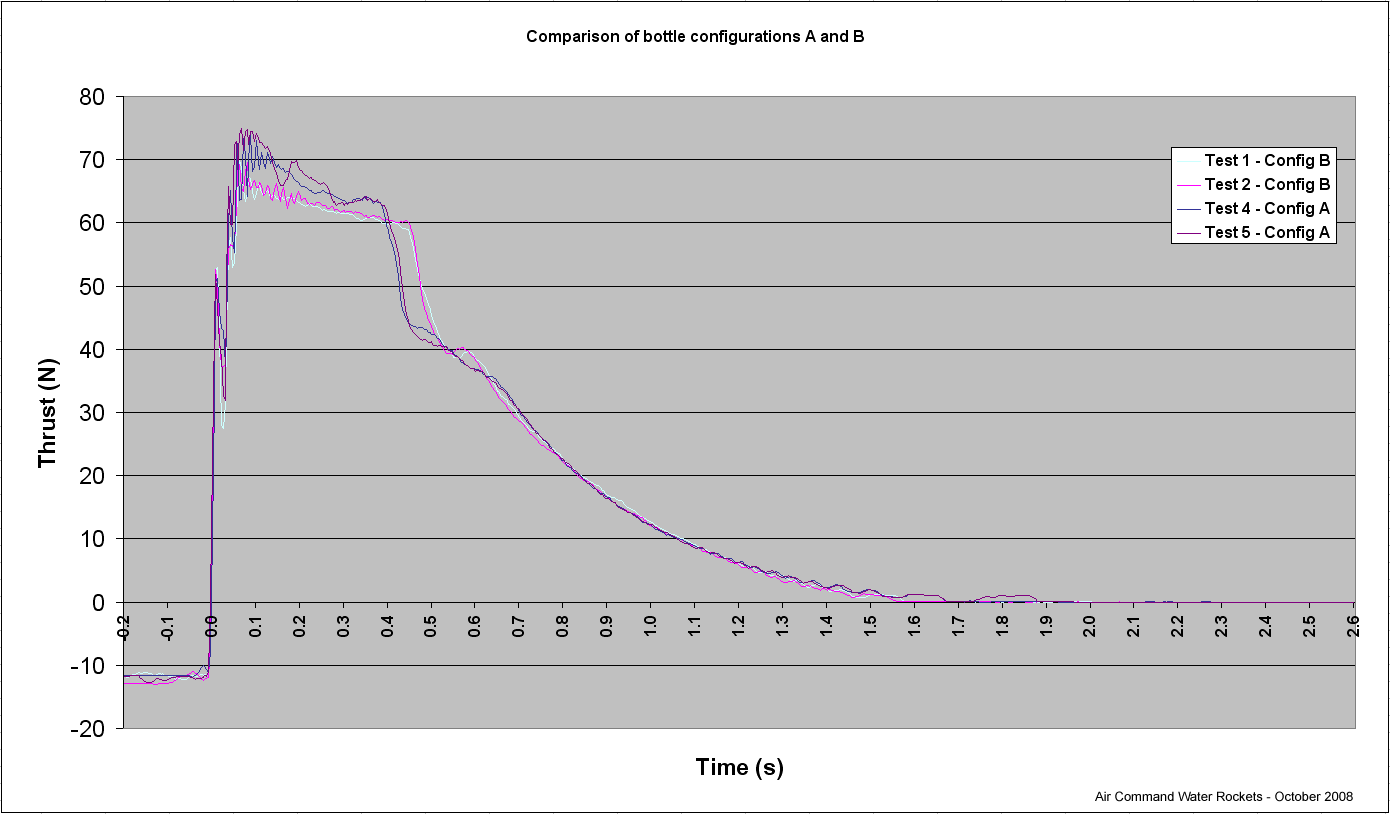
It is interesting to
note that although there was slightly more
variance in the thrust curve shape for
Configurarion
A, the Total
impulse was consistently 0.77 Ns or
1.7% higher than
Configuration
B. The
average thrust, however, was 1.1 N or
3.8% lower.
Comparison of the best two curves from each
configuration
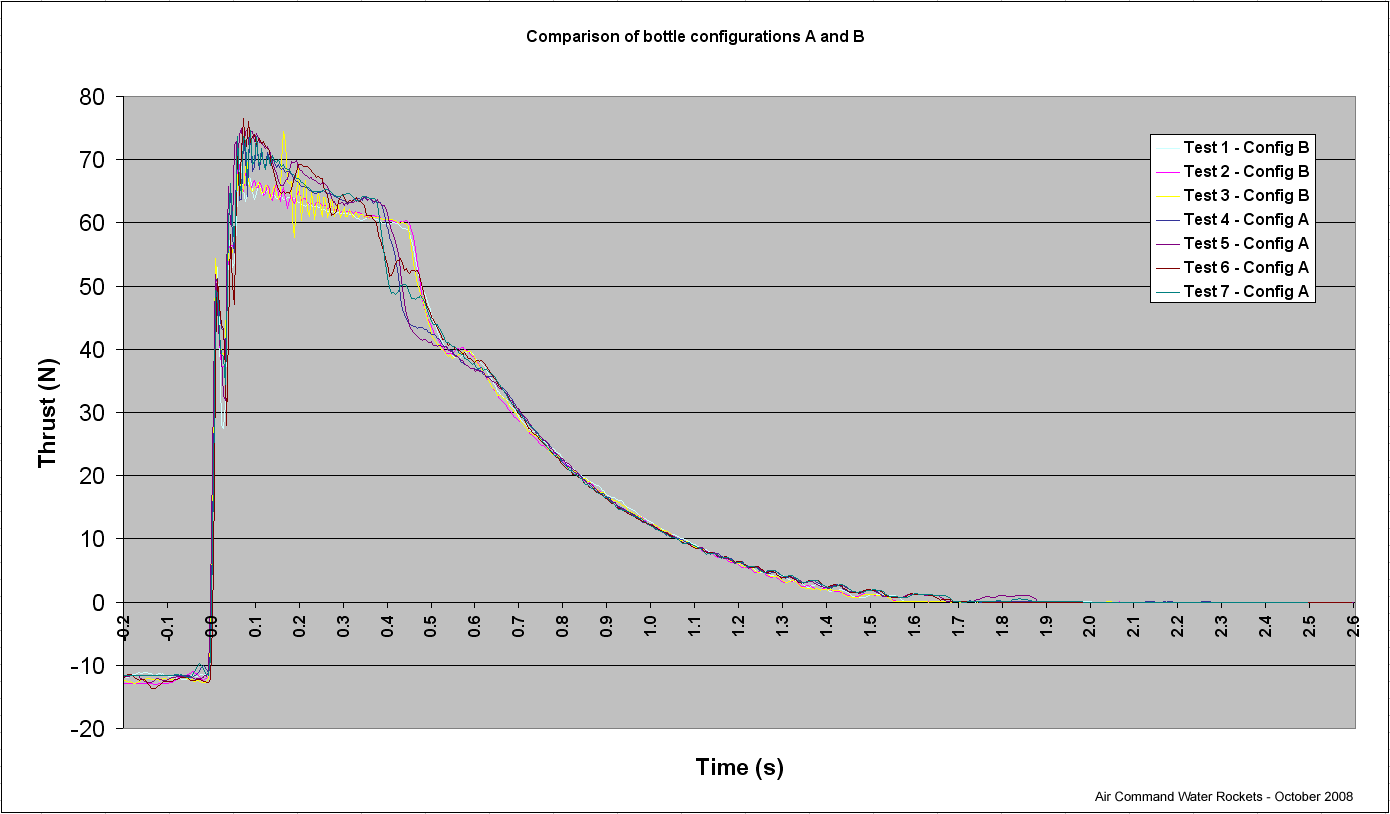
Comparison of all 7 tests
Bottom line
Although the
difference between Configurations A and B is
measurable, and contrary to what was
expected, it
is not significant enough at this pressure.
Follow on: -This needs to be
tested with higher pressures and larger
nozzle.
Experiment #2 - Jet
Foaming with and without foam
Aim
This experiment was
designed to see what effect of a small
amount of foaming agent dissolved in the
water has on the thrust curve.
Setup
The rocket was set up as
in
Configuration
A and water was distributed
in such a way that some amount was in the
upper bottle and some in the bottom bottle.
(Jet Foaming configuration)
Two runs were performed with water only
(test
#8 and
#9), and two runs with
1% concentration
of bubble
bath solution (test
#10 and
#11).
By weight the liquid was equal in all
four tests.
Observations
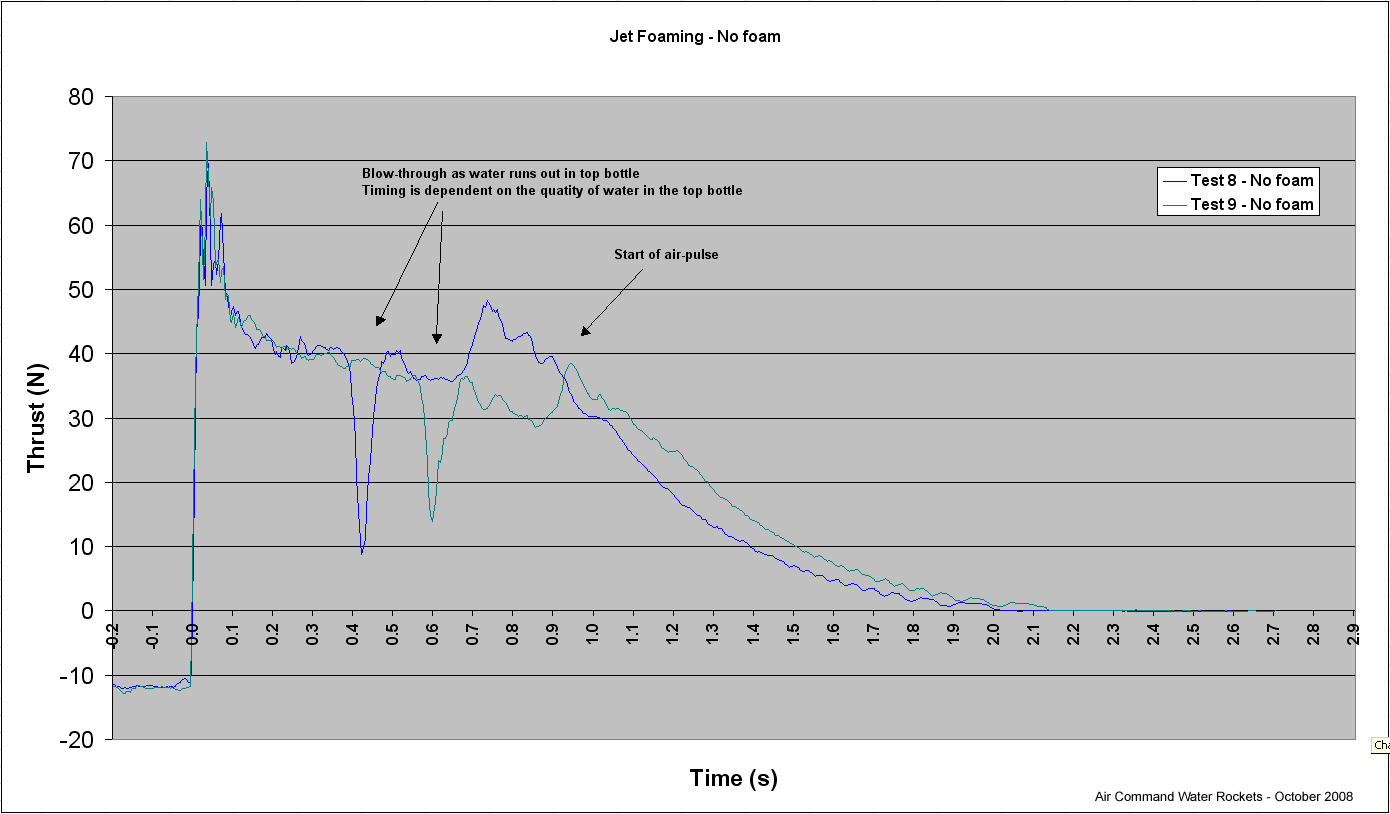
Thrust curves for test
8 and 9
The thrust curves for water-only showed a
significant deviation from those in seen in
Experiment 1. Of note were the large spikes
(loss of thrust) seen in the water phase. On
video analysis this was traced back to the
blow through effect with large bubbles
exiting the nozzle. After the water ran out
in the top bottle the water settled more in
the lower bottle and the thrust was more
conventional during the air-pulse.
The difference in timing of the large
negative spike is due to the differences in
the water levels in the upper bottle. The
more water there was in
the upper bottle the later the spike
occurs.
The total impulse average of the two tests
was 50.2Ns or 8% higher than
Experiment 1. The average of the average
thrusts was 24.24 N. which was ~12%
lower than Experiment 1.
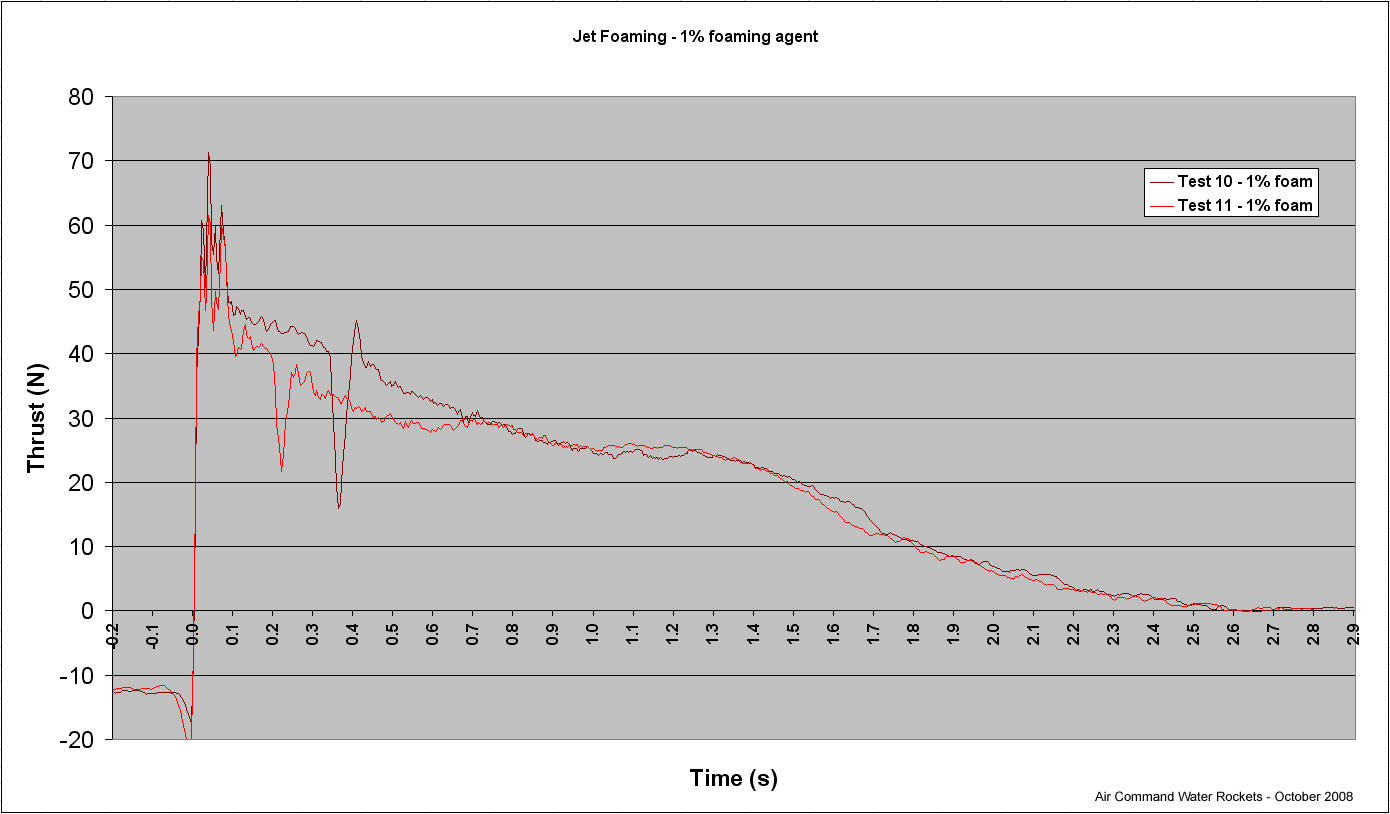
Thrust curves for test
10 and 11
Adding 1% bubble bath concentration to the
water (10mL of water was replaced with 10mL
of bubble bath) in tests #10 an #11 had a
significant effect on the shape of the
thrust curve. The thrust curve was more even
and produced a longer burn. The blow-through
spikes were also quite evident. The average
total impulse was 54 Ns and the
averaged average thrust was 20.75Ns.
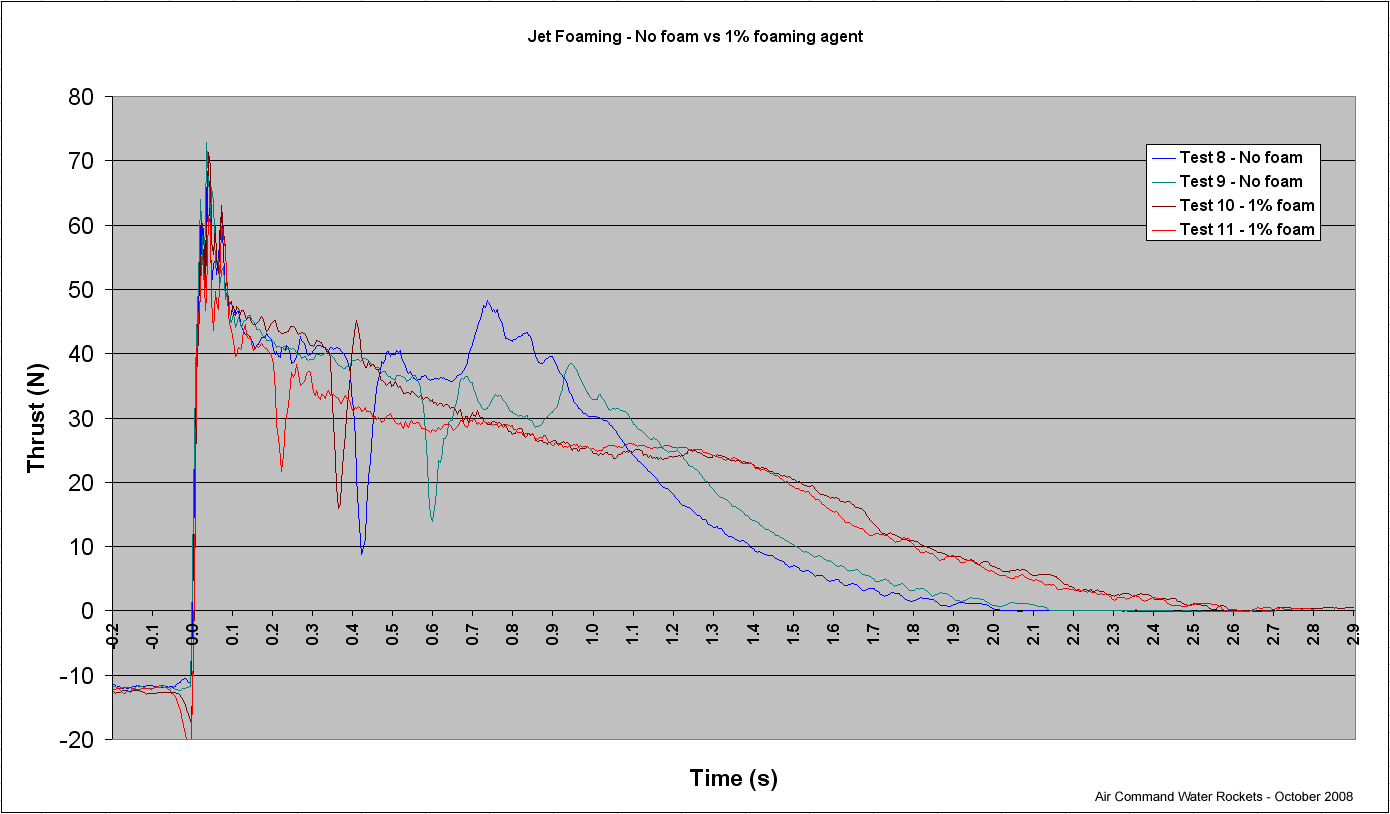
Comparison of no
foaming agent vs. 1% concentration
The thrust produced by the rocket with 1%
concentration had a total impulse of 7%
higher than water alone. At the same time
the 1% concentration produced a
14% lower average thrust.
Bottom Line
The total impulse
increased significantly for the foaming
agent and the average thrust at the same
time also decreased.
The foaming
agent even in low concentrations
has a
significant effect
on thrust duration.
Follow on: - Need to test with
higher pressures.
Experiment #3 - Jet
Foaming with 7mm vs 9mm nozzles
Aim
The main aim of this
experiment was to see how much of a
difference there is between the 7mm and 9mm
straight through nozzles.
This was
considered important as the 8mm Robinson coupling
chokes the flow of water out of the 9mm
nozzle. With a 7mm nozzle the
chocking happens at the nozzle.
Setup
Bottle
configuration A was used for this
comparison. Except for the nozzle diameter
all other rocket parameters were identical
for all four runs. Test #10 and #11 used a
9mm nozzle and tests #12 and #13 used a 7mm
nozzle.
Observations
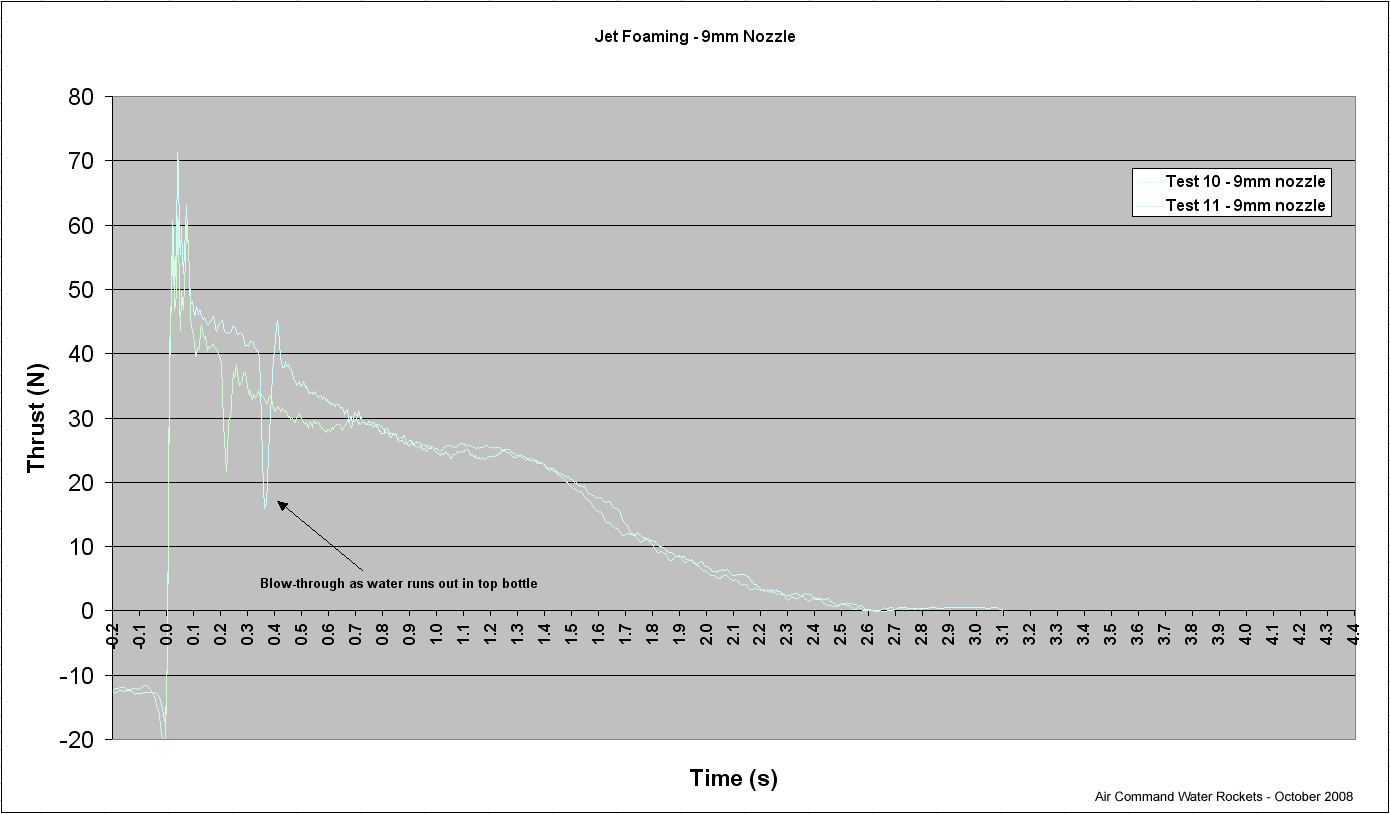
Thrust curves for test
10 and 11 - 9mm nozzle
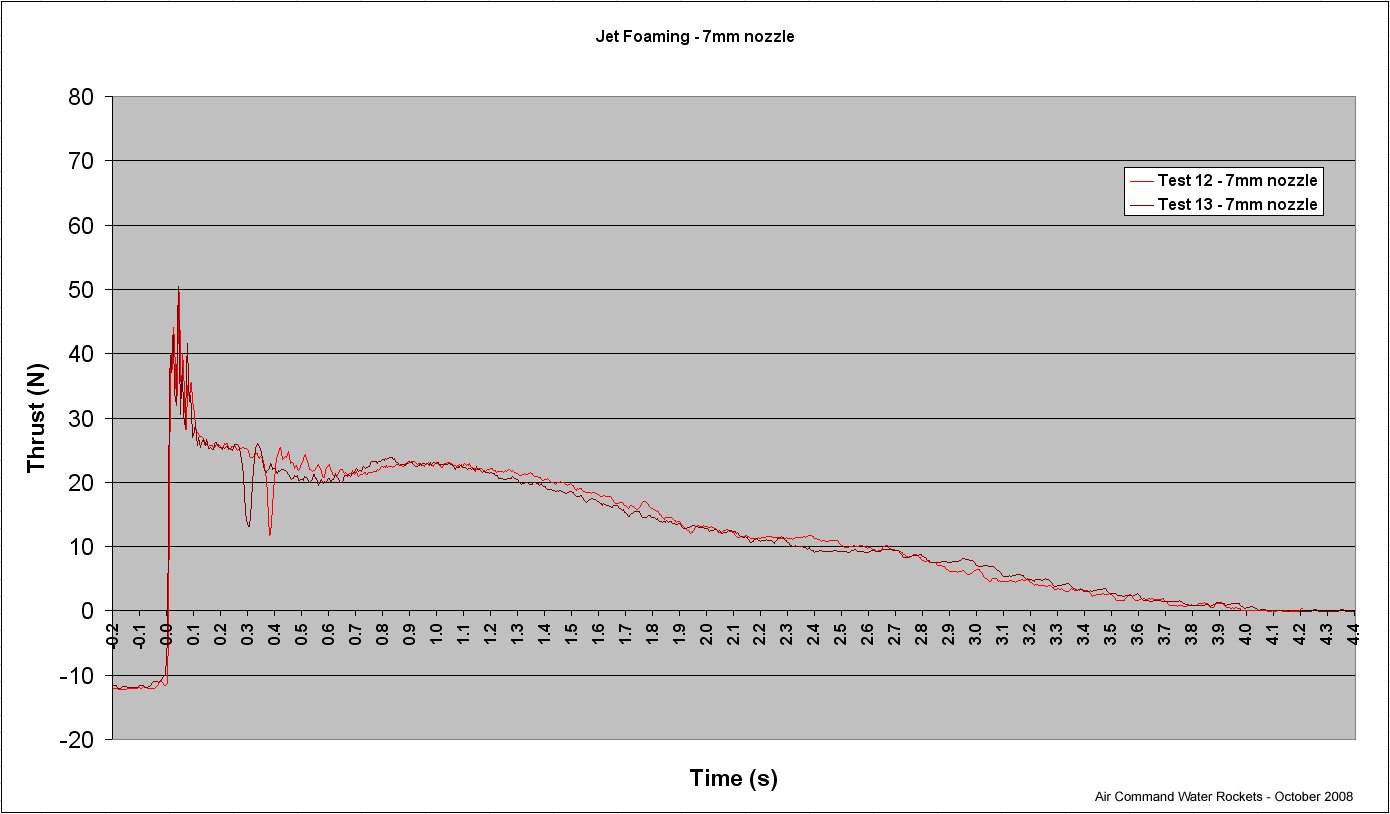
Thrust curves for test
12 and 13 - 7mm nozzle
When we look at the 7mm nozzle, there was a
significant increase in the duration of the
thrust as would be expected having the
mixture move through a 40% smaller cross
sectional area.
The average total impulse for the 9mm nozzle
was 54 Ns and the averaged average
thrust was 20.75Ns. While for the 7mm
nozzle the averaged total impulse was
54.9 Ns and the averaged average thrust
was 13.5 N.
Comparison of 9mm vs.
7mm nozzle
Bottom line
The total impulse for the 7mm nozzle was
only 2% higher, while the average
thrust was 35% lower. The total
burn time was increased from 2.6 seconds to
4.1 seconds or by 37%.
Experiment #4 - Foaming
agent concentration effect on Jet Foaming
Aim
This experiment set
out to see if changing the concentration of
foaming agent has any significant effect on the thrust.
The main driver for this experiment was
Anti-Gravity Research's record flight where
they used 30% detergent in their water.
Although they used a different detergent and
a different foam generation technique.
Setup
We performed only one
run(#14) of the high concentration test
mostly due to the
amount of detergent flowing into our garden.
We compared this to tests #12 and #13 as
they only used 10ml of foaming agent.
We placed 300g of the bubble bath
solution in a container and filled the rest
with water until the scale read 1000g. This
gave us the same mass of liquid in the
rocket. We measured by weight as the bubble
bath has a different density.
Observations
Comparison of 30% concentration of foaming
agent vs. 1%
The higher
concentration appeared to generate a much
more homogeneous foam solution and as a
result created a much smoother decaying
curve. The total impulse for the higher
concentration was 54.53Ns and the
average thrust was 11.68N the lowest
out of all the tests. This was also the
longest burn of all the tests at 4.6
seconds.
While the total impulse was within 1%
of the lower concentration, the average
thrust was 13% lower. The burn
duration was also 13% longer.
Bottom line
There was
enough of a measurable difference to warrant
further investigation on higher foaming
agent concentrations.
Experiment #5 - Jet Foaming with
different sized air pockets
Aim
From previous experiments
we have learned that a non trivial amount of
weight in the form of residual foam remains
in the rocket when all the air is gone. In order to minimise the amount of
foam remaining in the rocket one approach we
are considering is to use a small mixing chamber
as the lowest bottle in the stack. This would allow foam
to only form in the small volume of the
bottle and hence lower the amount of foam
left in the
lowest bottle.
Because of the small
volume we wanted to see if it's better to
have a small pocket of air in the lower
bottle or a larger one.
Setup
We set the rocket up as
Configuration
C and let water fully drain into the
lowest bottle. We also used 1.2L of water
for this test with 1% concentration of foam.
We were going to do the 95% test first but
found that during the normal filling rate
about 60% of the water was pushed up to the
upper bottle. The problem was that once
pressurised it would not drain back. So we
tested that one first.
For the second test we
had to fill really slowly and it took about
8 minutes to fill the rocket with air
without pushing the water into the upper
bottle.
The idea is that in a
real rocket there would be a narrow launch
tube that fits through the Robinson coupling
and emerges above the water line. This would
allow the rocket to be pressurised without
creating any foam in the upper bottles, and
only creating foam in the lower bottle once
launched.
Observations
With the lower bottle
being mostly full it effectively worked as a
single full bottle and as a result the
thrust curve looked more like a water only
one with not much foam being produced.
The test with the much
larger air pocket generated much more foam
and as a result the thrust curve was more
like normal foam. The total impulse for the
40% water (test #15) was 47.57Ns and
the average thrust was 13.05N.
Comparison of mixing
chamber air pocket size - 40% vs. 95% water
in the lower bottle
The total impulse for the
95% water (test #16) was 41.17Ns and
the average thrust was 15.83N. This
means that the larger air pocket gave a
15% higher total impulse while lowering
the average thrust by ~17%.
It was interesting to
note that there was no significant blow
through spike evident in either of these
tests.
Bottom line
The air pocket
size is very important for generating
more foam.
Experiment #6 - 2L of
Fizzy lemonade used in Jet Foaming
Aim
This was more of a fun experiment
to do at the end of the day, but it has to
be one of the most common questions we get
asked if we have put soda water into our
rockets to see if they fly higher. Actually
we needed the empty bottle to use in a new
rocket, and it was either dump the lemonade
down the drain or through a nozzle. As Damo
later pointed out we should be now worried
about more ants in the garden.
Setup
We used
Configuration
A for the bottle setup, and since there
were 2L of lemonade we allowed it to drain
into the lowest bottle and the rest went
into the upper bottle. One of the biggest
problems was that as the lemonade was poured
through the funnel quite a bit of CO2 was
released and while the rocket was
pressurised even more was liberated so by
the end it was difficult to say how much
actually stayed dissolved. The total impulse
was 50.97Ns and the average thrust
was 12.27N. It is difficult to
compare this to any of the other tests as a
different volume of water was used.
Thrust curve for 2L of
fizzy lemonade
Bottom Line
Needs to be performed
again but without filling through the water.
Most likely through a fill tube above
the water line.
The
lemonade seemed to remove the residual
foam from the bottle really well.
Needs
to be compared to 2L of normal water to
see what difference there is.
Conclusions
When only air passes through a
relatively narrow Robinson coupling
there is no significant effect on thrust
when both the nozzle and coupling
diameters are similar.
There is a large momentary loss of
thrust during jet foaming when the water
runs out in the top bottle. The spike is
more pronounced in jet foaming most
likely because the density of the
liquid/foam in the bottom bottle is
lower than just regular water. The
air/water mixture can punch through it
more easily.
The large blow-through spikes seen
in a lot of the tests were directly
attributable to air bubbles exiting the
nozzle when video of the tests was
analyzed and explain the
foam
thrust anomaly identified previously
when we lacked the sample rate to
clearly identify it.
When we compare the total impulse of
water alone (test #2) and foam (test
#10) we see that in effect foam had
19.2%! more "energy". This is a very
significant number. At the same time the
average thrust was 25%
less. This will require further testing
at higher pressures and at "optimised"
water levels. How the extra impulse
translates to actual altitude is a
little more complex but is highly
dependant on weight of the rocket and
drag. More on this in future updates.
There is a long bump in the middle
to later part of the foam thrust curves
that suggests perhaps some optimal
combination of foam/air mixture where
the thrust does not decay as one would
expect. This may be due to water
settling out of the foam. Foam no longer
being efficiently generated perhaps?
This will need further investigation.
When using a
reduced mixing chamber size for jet
foaming it is important to have a large
air pocket in the small bottle.