Software
An application was written specifically
for the
static test stand to assist in converting
the raw data captured by the data logger
into meaningful thrust curves. The
application performs all the necessary data
processing such as filtering, offsetting and
scaling.
The application uses start and end markers
positioned on the time line to allow the user to
perform various
functions between them.
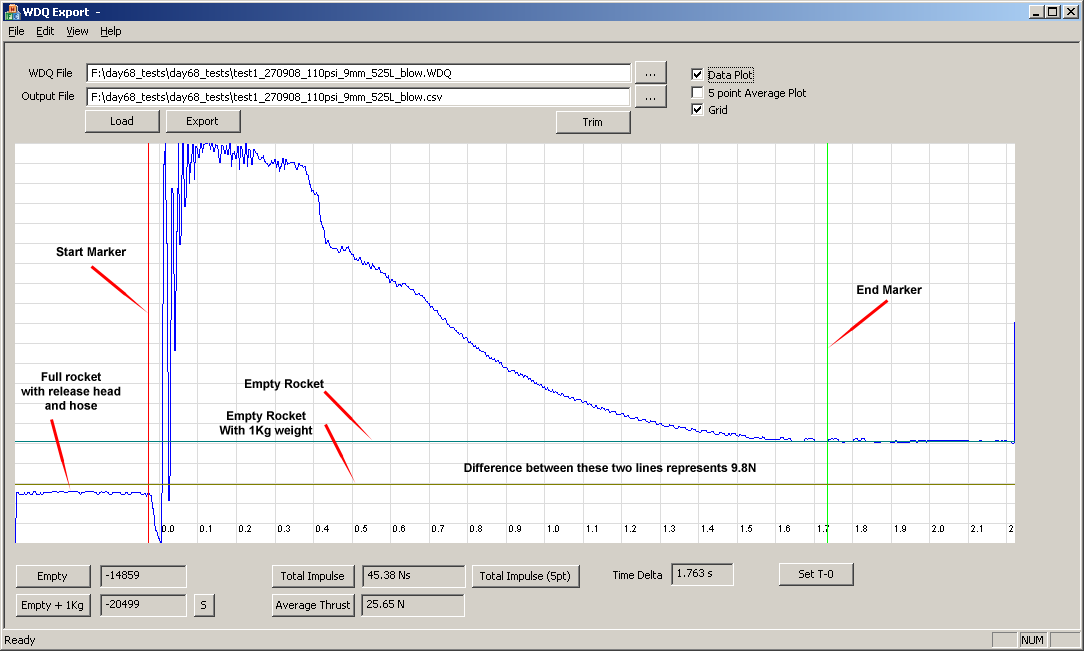
Screen shot of the
thrust analysis and export application
Trimming - Clicking the
Trim
button discards any time line data outside
the markers.
Calibrating - Selecting a time
segment on the thrust curve after the rocket
stops producing thrust (i.e. the rocket is
empty) with the start & end markers and clicking the "Empty" button the application
will calculate the average value in the time
segment and sets this value to be the "Zero
thrust" value for the other calculations.
(see top of document)
Selecting a time segment on the thrust curve
with the rocket empty and the 1Kg weight
applied and clicking the "Empty + 1Kg"
button the application again calculates the
average for that time segment and sets that
as the
other calibration mark.
The difference between these two
calibration marks represents
9.8N and is used as the amplitude scaling
factor by all calculations for the
waveform.
The application also automatically generates a
5 point moving average waveform from the raw
data which essentially eliminates most of the
"ringing" seen at the start of the raw waveform.
Time measurement is achieved by
using the start and end markers. Positioning
these on events the Time Delta
field displays the time between these
markers. Clicking the "Set T-0" button
resets the zero time to start at the
start marker.
Calculating total impulse - The
start and end markers are positioned either
side of the waveform and clicking the "Total
Impulse" button calculates the area under
the raw data curve and the zero thrust line.
The value is displayed in Newton seconds.
Clicking the "Total Impulse 5pt" button
calculates the total impulse based on the
averaged waveform.
You can position the start and end markers
on any part of the waveform and calculate
the total impulse only for that segment.
This is useful for calculating the total
impulse portion attributable to say the
water phase or the air phase.
Calculating average thrust - This
is done the same way as calculating the
total impulse but the "Average thrust"
button is clicked instead. Average thrust
can be again calculated on portions of the
waveform based on the position of the start
and end markers.
Clicking the Export button will
export the current data to a CSV file
allowing further processing in Excel.
This application is available on request. |